Aquafonix
What’s my hydrophone picking up?
A portable desktop monitor for hydrophones. It watches the signal live or replays a whole deployment, flags the sounds you’ve taught it, and measures everything in proper underwater-acoustics units.
- Year
- 2026
- Type
- Windows desktop app
- Built with
- Python, Qt, NumPy
- Status
- Version 0.1
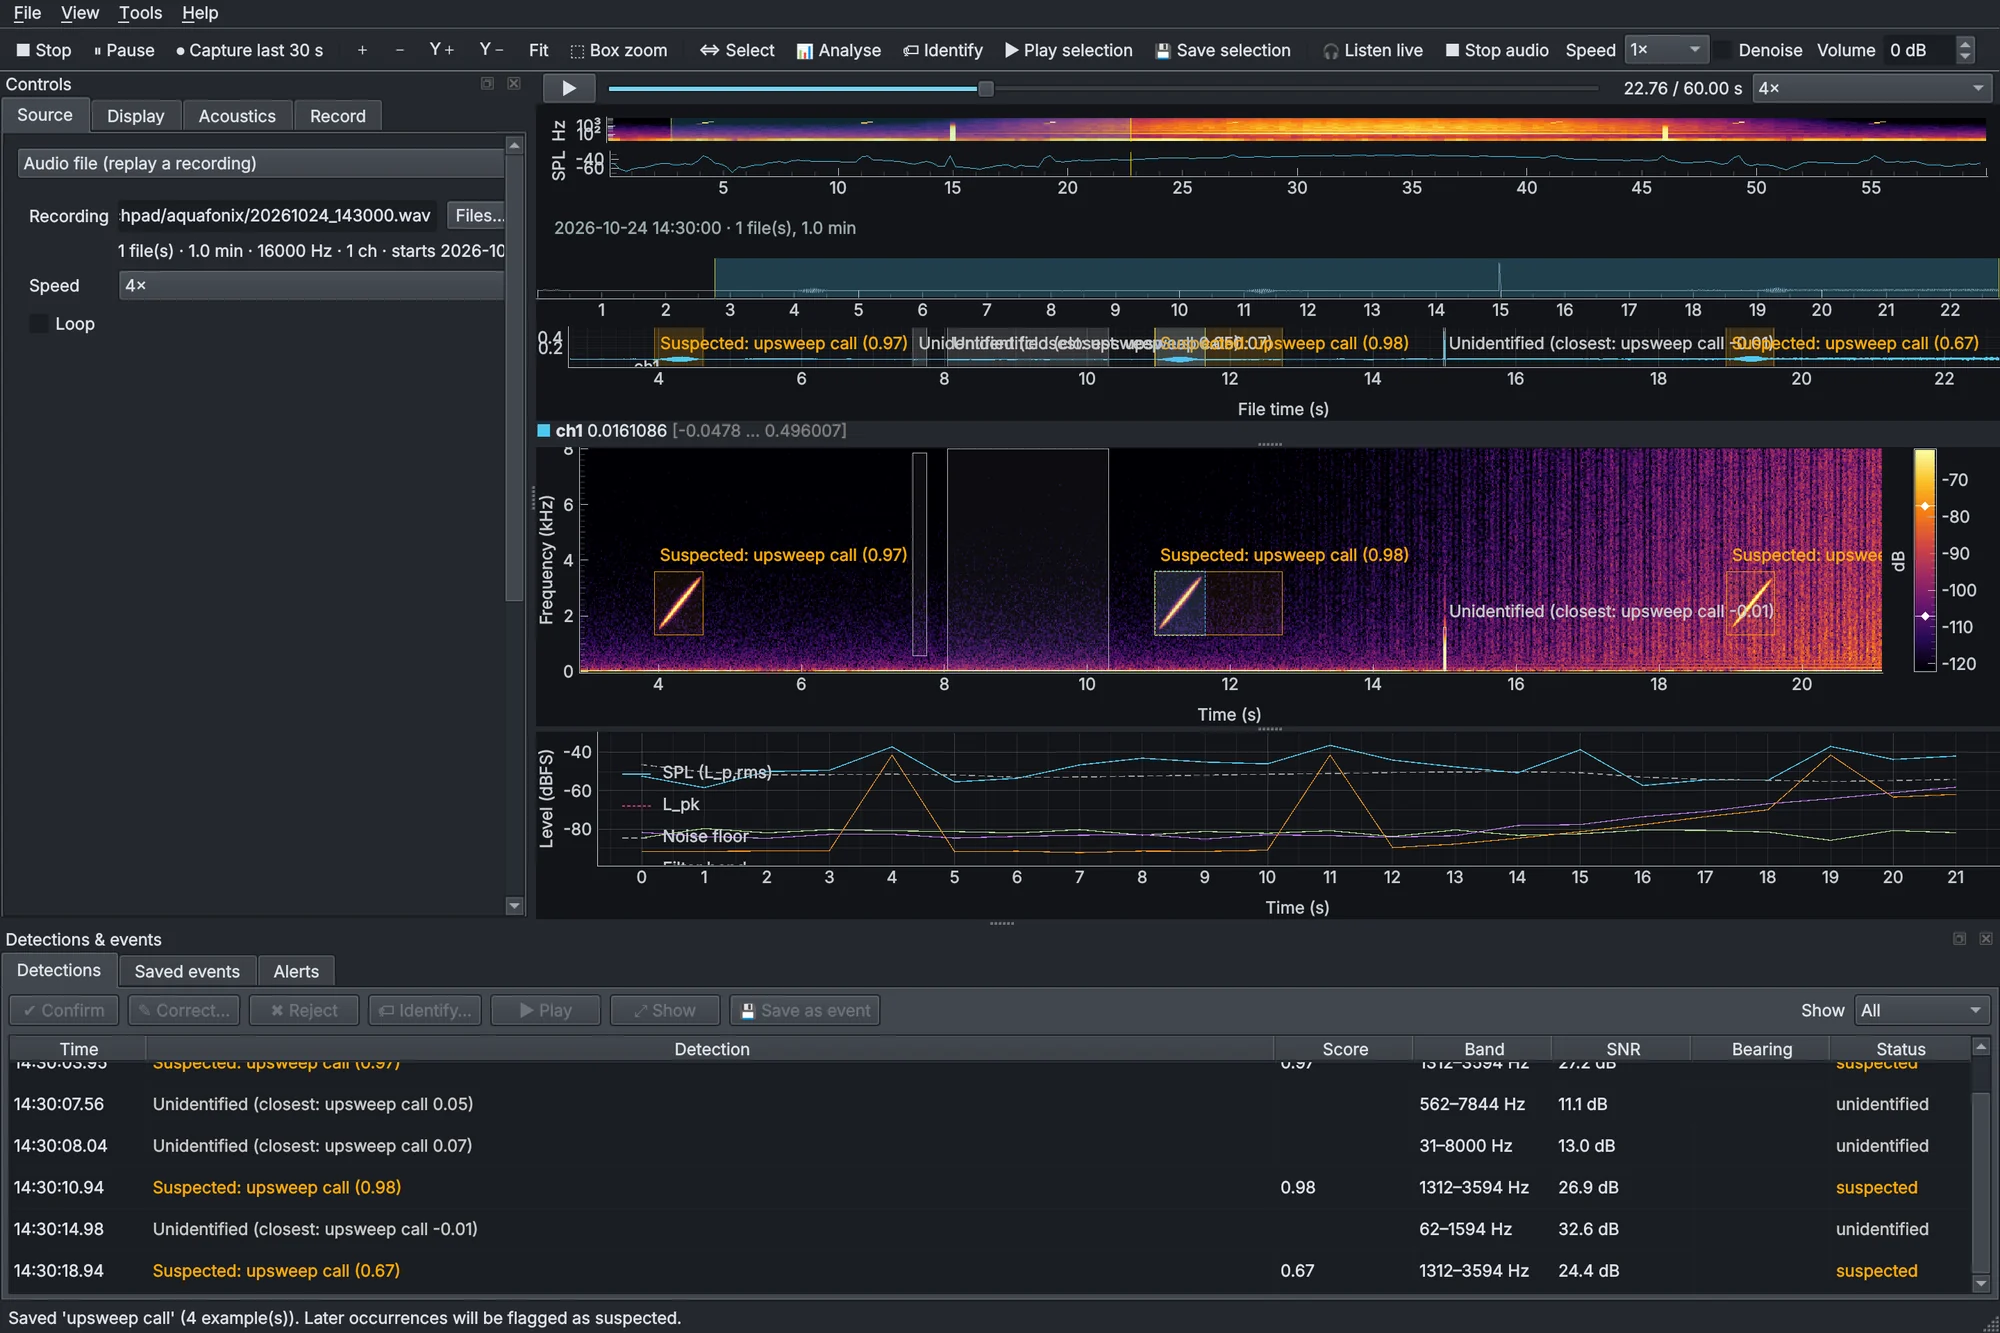
A listening station on a laptop
Leave a hydrophone in the water and you come back to hours of hiss with a few seconds worth hearing buried somewhere in it. Aquafonix watches the signal as it arrives, or plays back a folder of recordings as one continuous timeline with clock times taken from the file names, and points you at the moments that matter.
It isn’t only for audio. It takes any microphone or audio interface, WAV, FLAC and AIFF files, serial and network data streams, and even a graph drawn on screen by another program, whose line traces or spectrogram colours it reads back into numbers. Whatever comes in gets the same waveform, spectrogram, spectrum and levels, and the same toolkit on top.
It learns what you’re listening for
-
A catalogue you teach
There’s no fixed library. Snip a sound and name it, and later occurrences are flagged Suspected with a score. Every confirm, correction or rejection teaches the catalogue, so false matches stop coming back.
-
Numbers you can report
SPL, peak level and SEL, spectra with percentiles and every IEC third-octave band, calibrated to dB re 1 µPa from the hydrophone’s sensitivity or the file’s own metadata. Batch mode turns a folder into CSV reports.
-
It hears boats
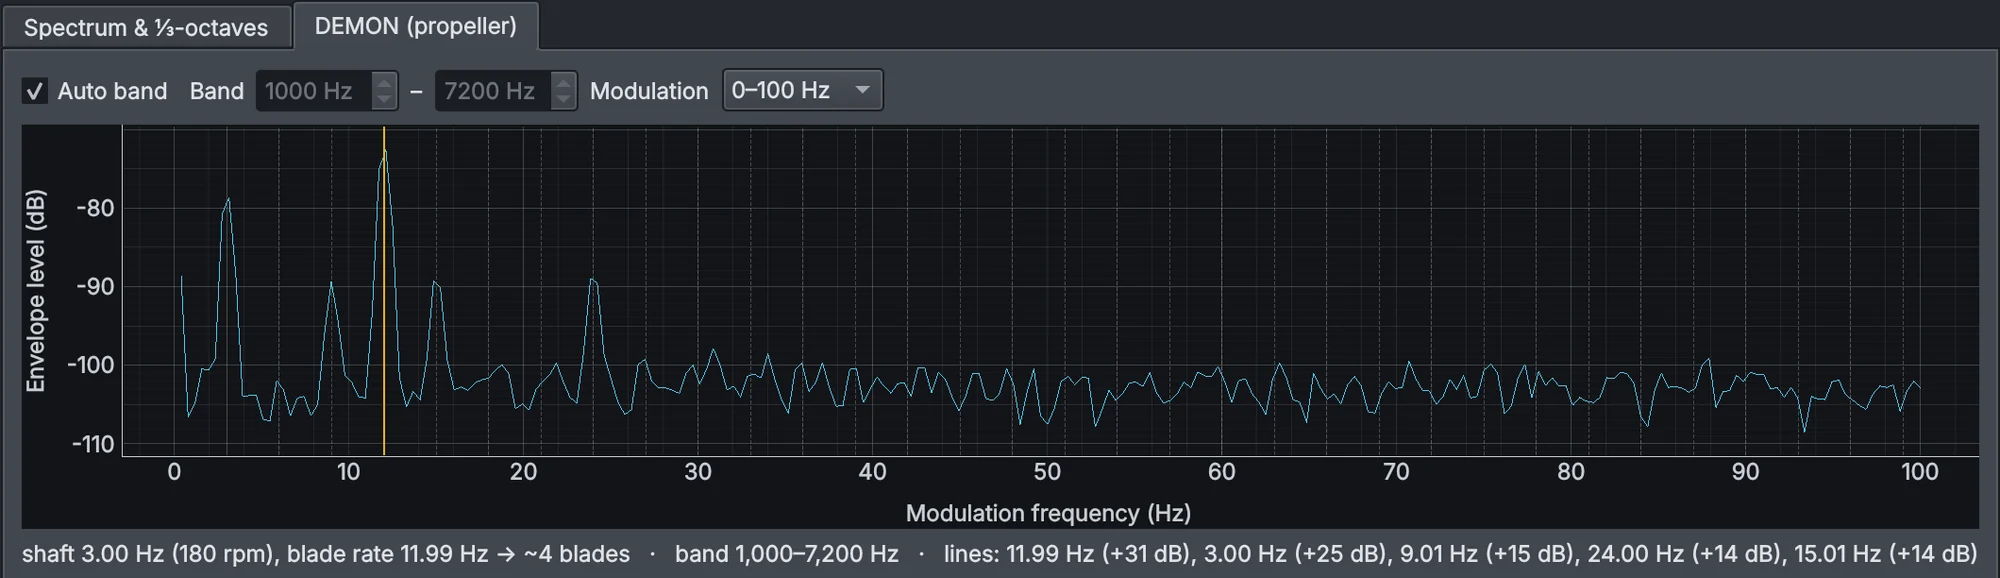
DEMON analysis pulls a propeller’s shaft and blade rates out of the cavitation noise. With a pair of hydrophones, every detection also gets a bearing, and a scrolling bearing-time display shows what’s moving.
-
Ready for the rest of your kit
Alerts on chosen sounds, levels or propellers can play a sound, pop up and save the moment. Detections and levels go out as JSON over UDP, TCP, a webhook or a file, and Raven selection tables go both ways.
Name it, let it listen, measure it
-
01
Name a sound
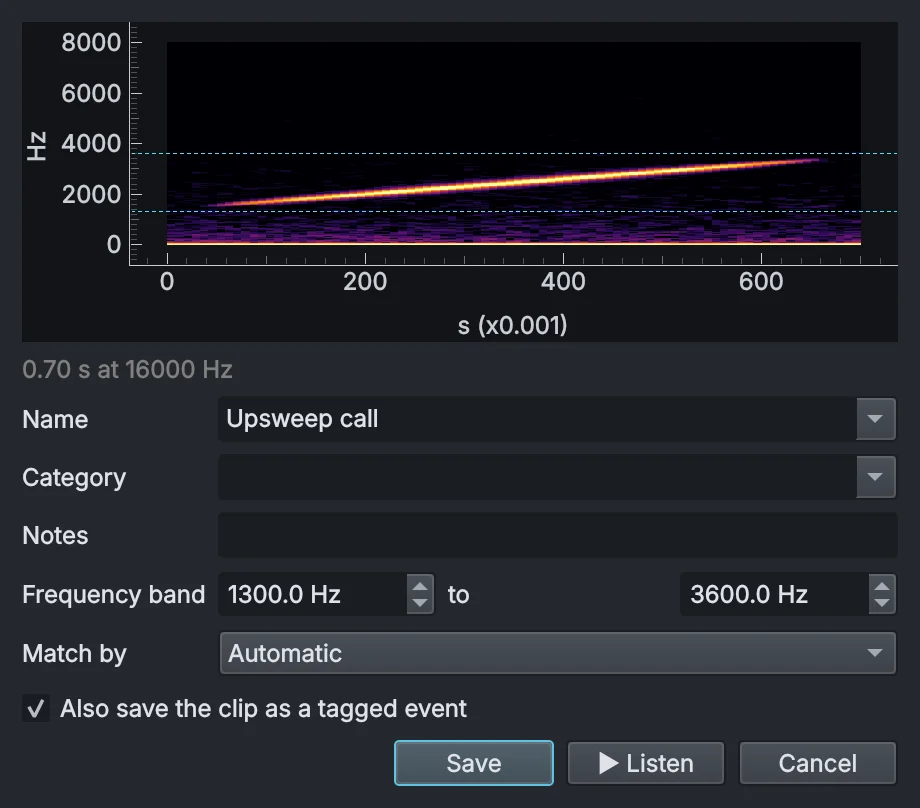
Shift-drag around something on the spectrogram and press Identify. Give it a name, check the frequency band, and the snippet becomes a signature, saved as a tagged event too if you like.
-
02
Let it flag the rest
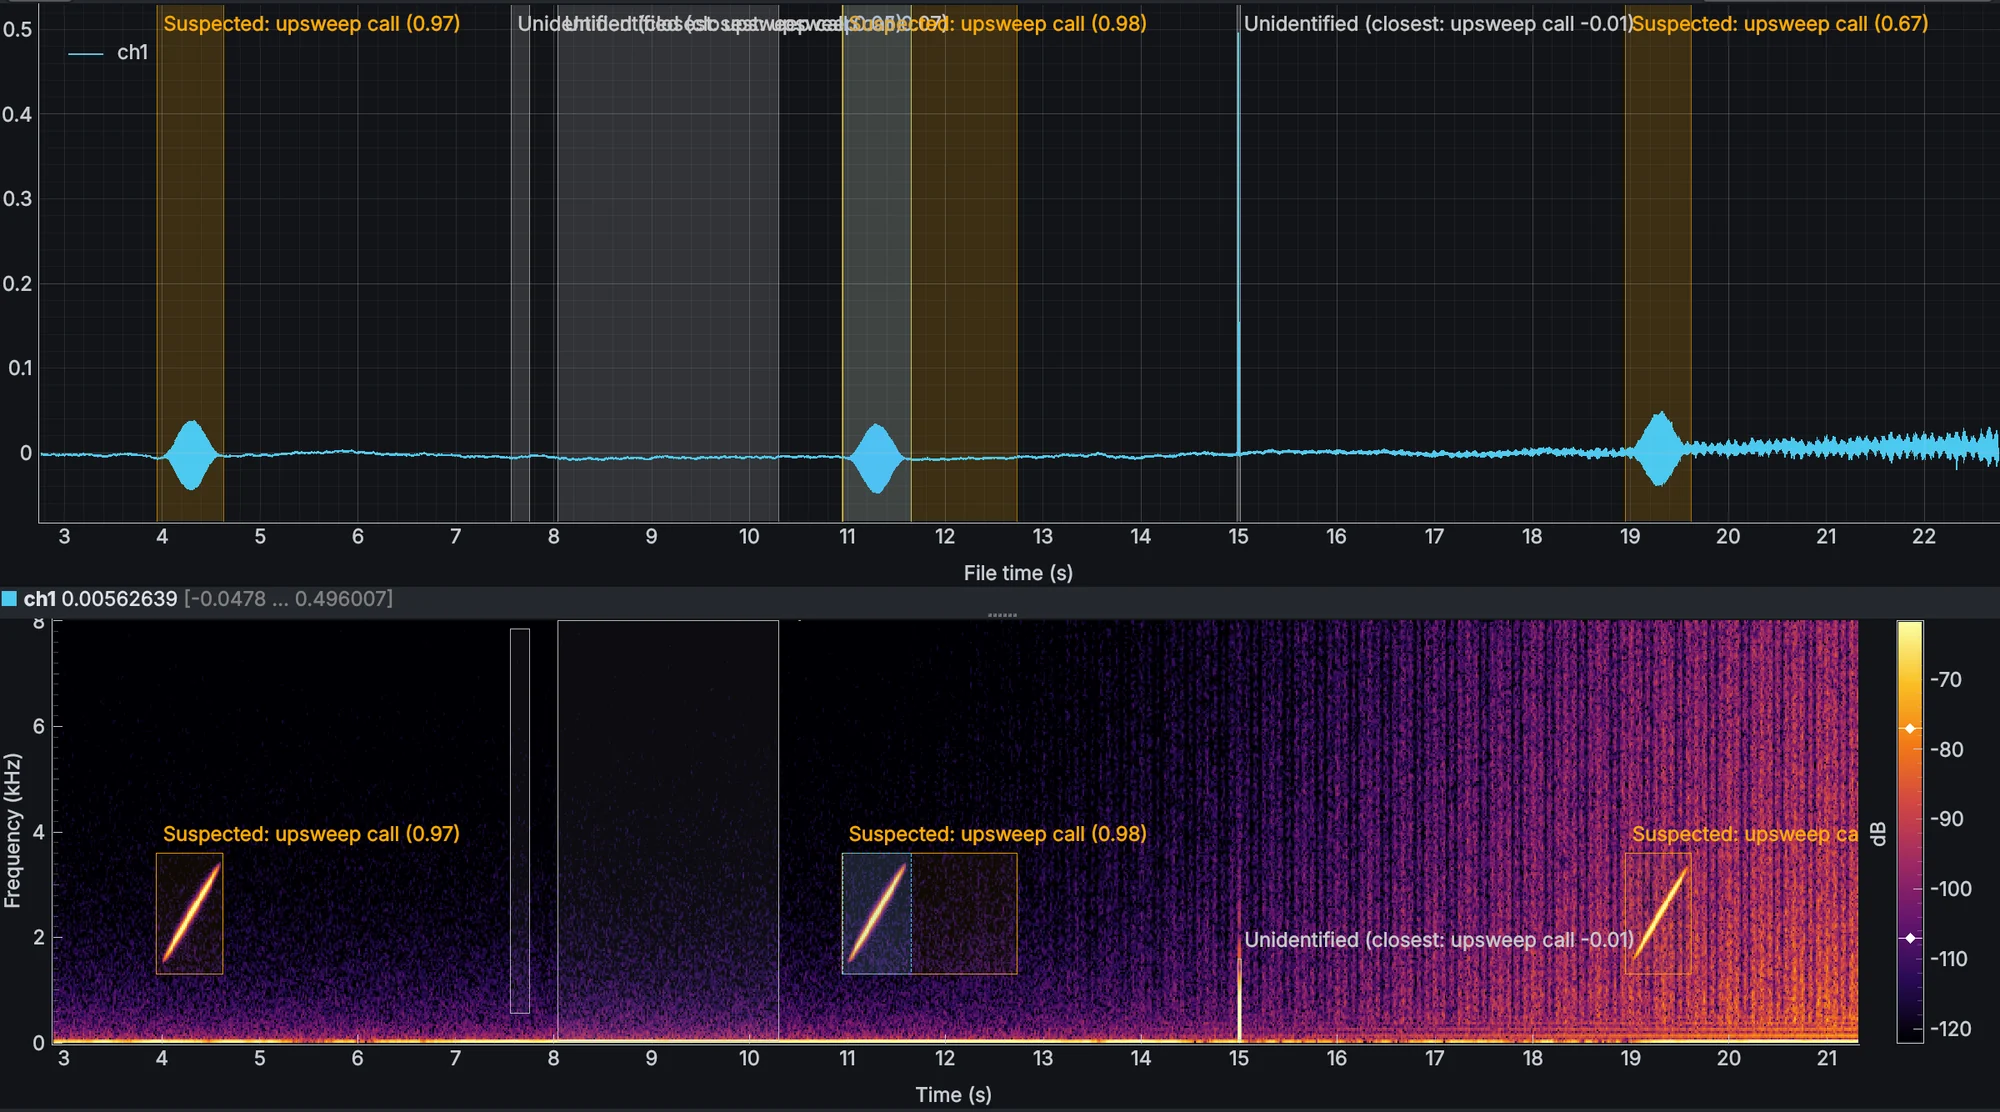
Anything that rises above the tracked noise floor is boxed in time and frequency. Sounds that match a signature are flagged Suspected with a score, and the rest are listed as unidentified with their closest match, ready for you to confirm, correct or reject.
-
03
Measure it
Select a stretch and Analyse it for levels, bandwidths, kurtosis, spectrum and third-octaves, all exportable to CSV. The DEMON tab finds the propeller: on the test boat here, a 3 Hz shaft (180 rpm) and a 12 Hz blade rate, so about four blades.
How it’s built
- Interface
- Qt through PySide6, with pyqtgraph for the plots
- Analysis
- NumPy: Welch spectra, IEC 61260-1 third-octave bands, GCC-PHAT bearings and DEMON
- Inputs
- sounddevice and soundfile for audio, pyserial for COM ports, mss for screen capture
- Packaging
- A single-file Windows exe built with PyInstaller and smoke-tested in GitHub Actions