Infograph
A subset of a segment of a slice.
A small tool for picturing parts of a whole. Split a rectangle, nest one inside another, and label them until the picture matches what you mean.
- Year
- 2026
- Type
- Web app
- Built with
- Next.js, React, Tailwind
- Status
- Prototype
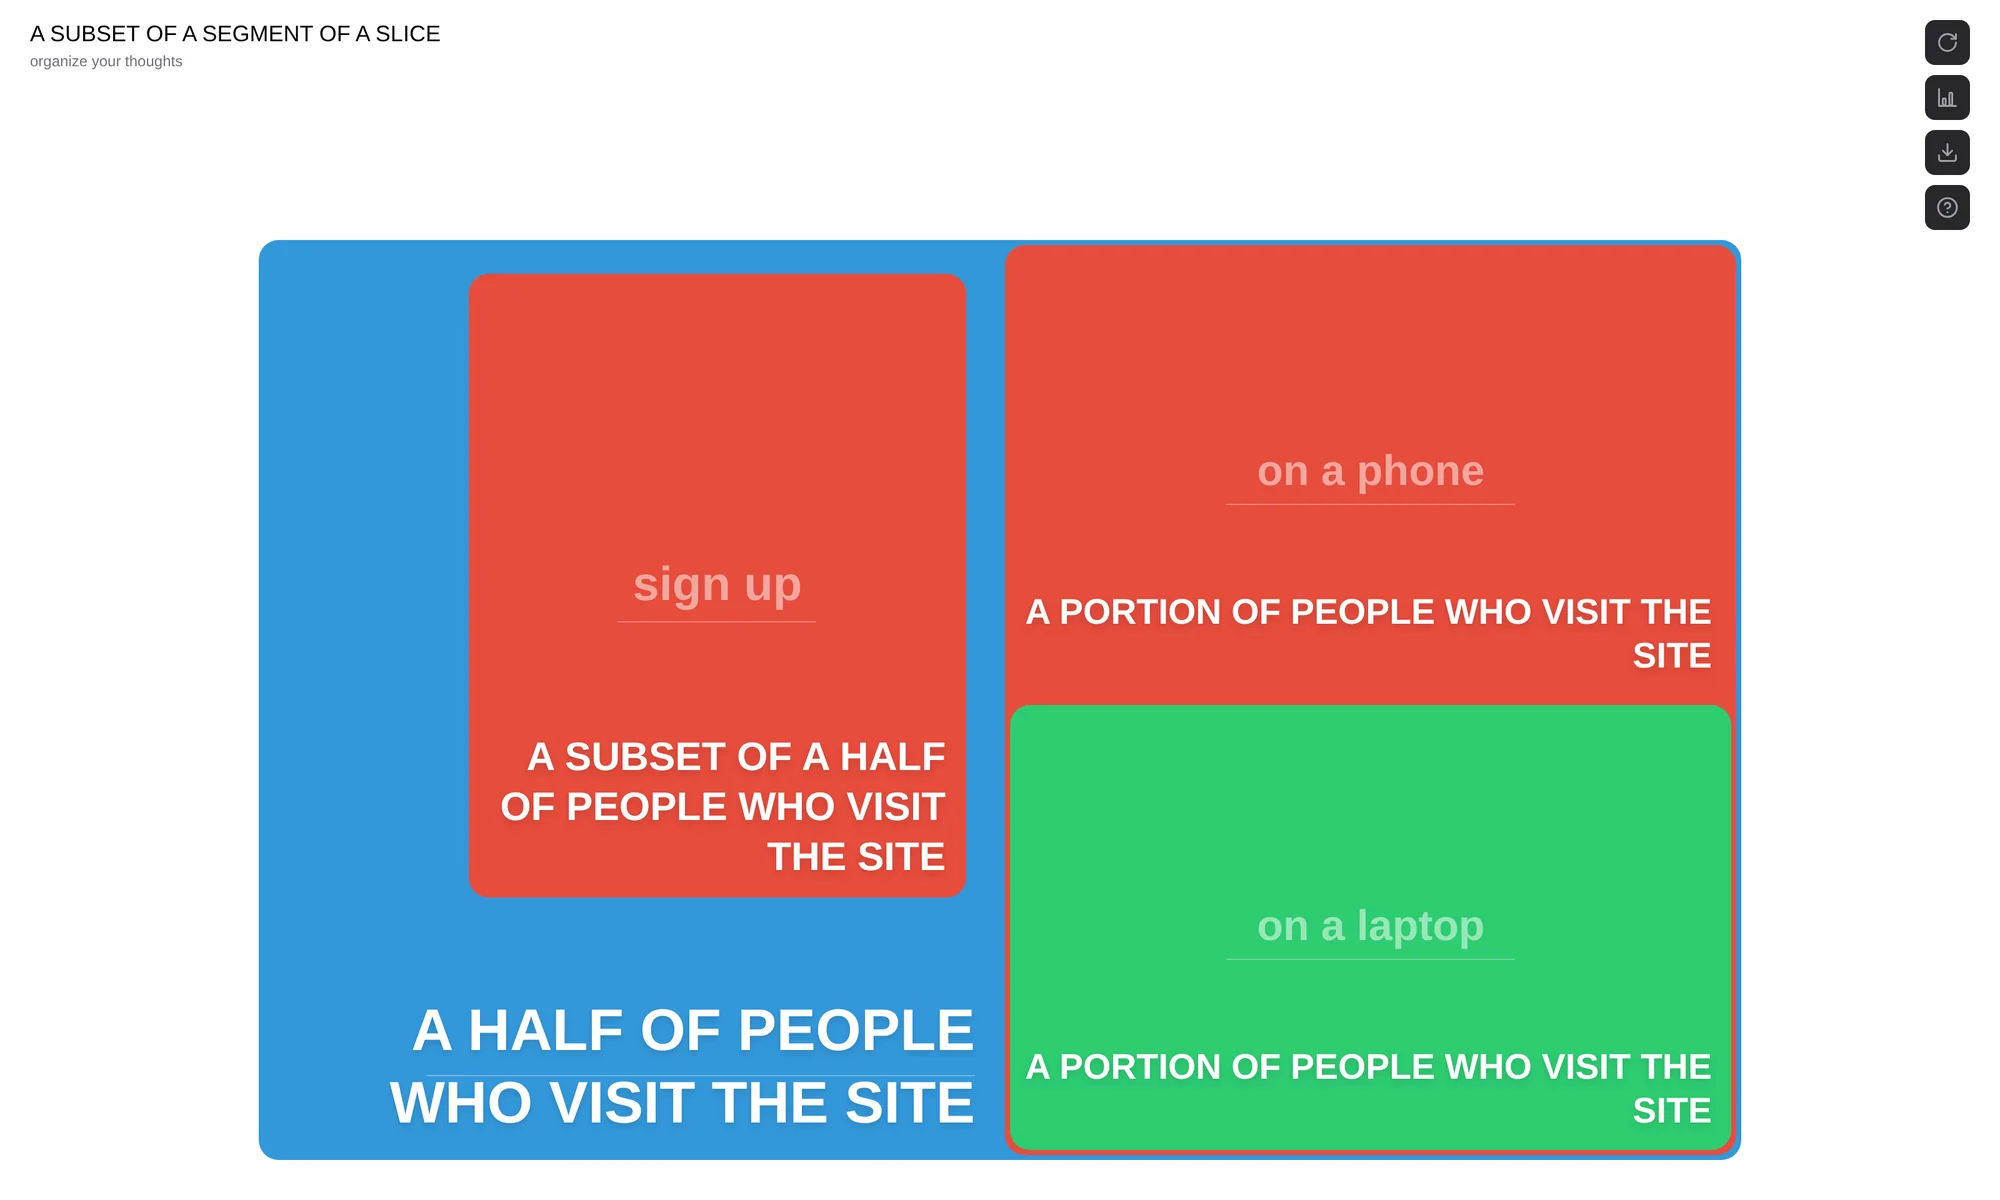
Who are we actually talking about?
Conversations about users, customers or markets slide between groups without anyone noticing: everyone who visits, then the ones who sign up, then the ones who sign up on a phone. It’s hard to keep track of which slice of which whole is under discussion.
Infograph makes the slices visible. Start with the whole, split it in two, nest a subset inside a part, and keep going. Each rectangle names itself from where it sits, so the picture always says what fraction of what you’re looking at.
A picture everyone can point at
-
Labels that write themselves
A split becomes “a half of” whatever it came from; type numbers and it switches to percentages. Nest a subset and the label follows it down.
-
Two moves, any shape
Split divides a rectangle in two; subset nests a smaller one inside. Repeat up to six levels deep and the layout adapts to fit.
-
A table when you want one
The data panel shows the same hierarchy as rows you can rename, split, merge or remove, for when it’s faster to edit than to click.
-
Ready for the slide deck
Export the chart as PNG, JPEG or SVG and drop it into the document where the discussion is happening.
From one rectangle to many
-
01
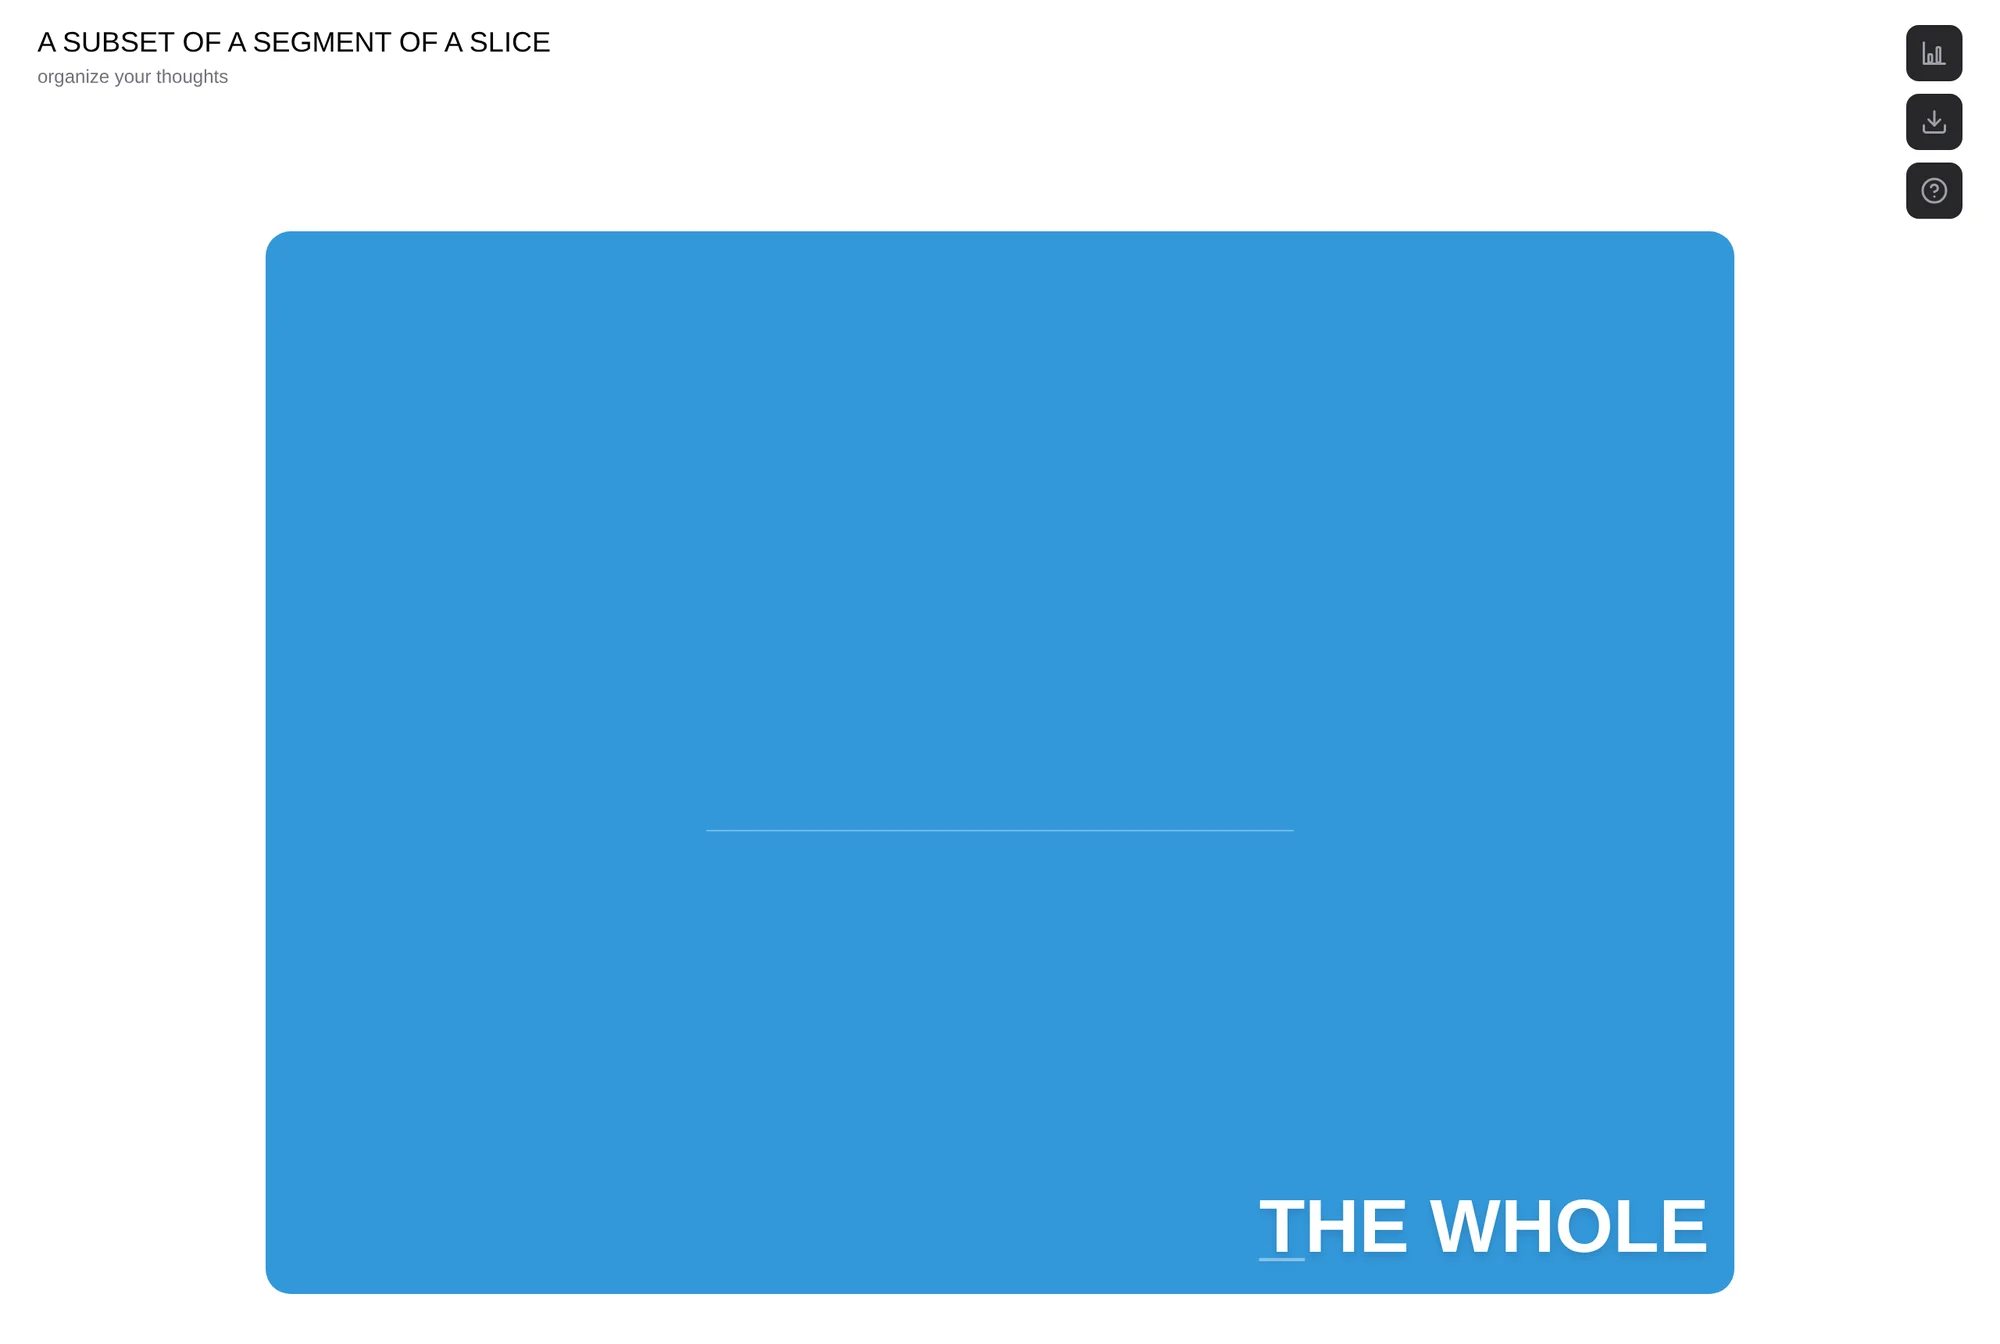
Start with the whole
Every chart begins as one rectangle. Name it after the group you care about: people who visit the site, everyone in the room, all of last year’s orders.
-
02
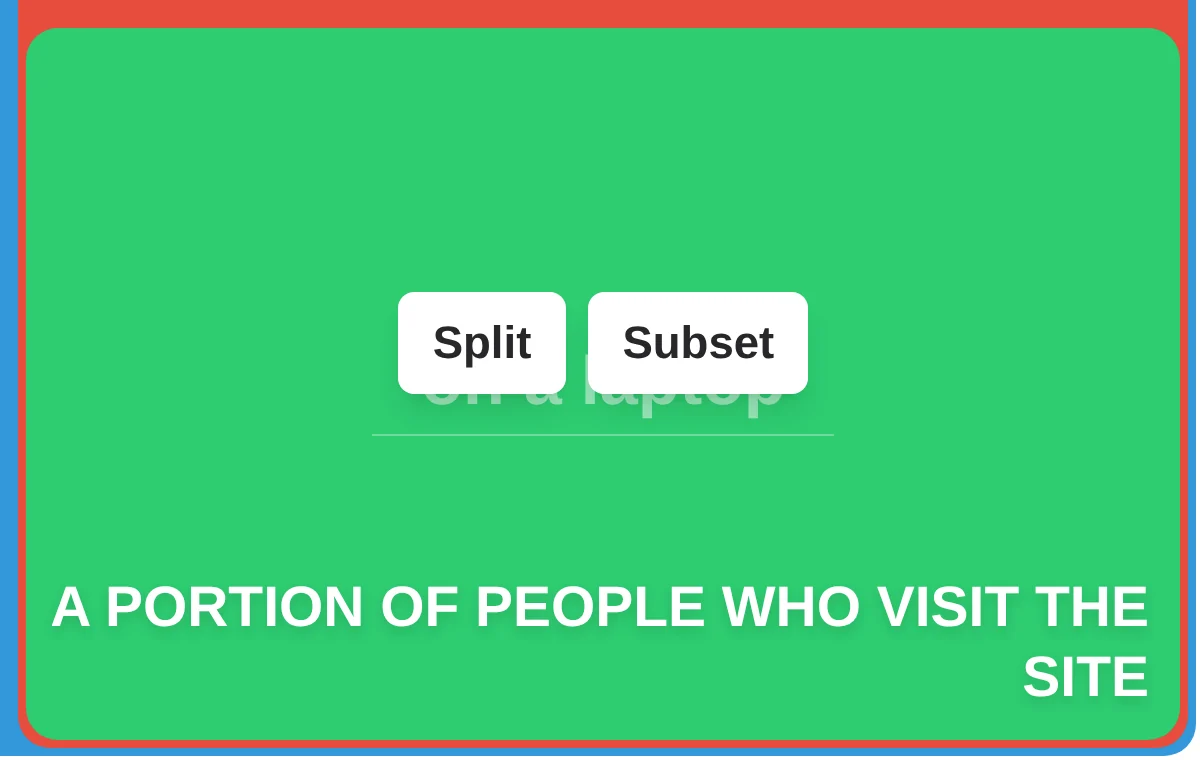
Split it, or nest a subset
Tap any rectangle for its options. Split it to show two groups side by side, or add a subset to show a smaller group inside it. Type a label on the line in the middle.
How it’s built
- Framework
- Next.js and React, with the React Compiler on
- Layout
- A recursive tree of rectangles that measures itself and picks a horizontal or vertical split to suit its shape
- Styling
- Tailwind CSS, with a sixteen-colour palette that keeps neighbours from matching
- Export
- html-to-image, at three times screen resolution for PNG and JPEG