Liftseeker
Where should we fly today?
A daily ranking of paragliding sites across Canada. Liftseeker reads the soaring forecast for every site and puts the best flying at the top of the list.
- Year
- 2025–26
- Type
- Web app
- Built with
- Next.js, TypeScript, Chart.js
- Status
- Live
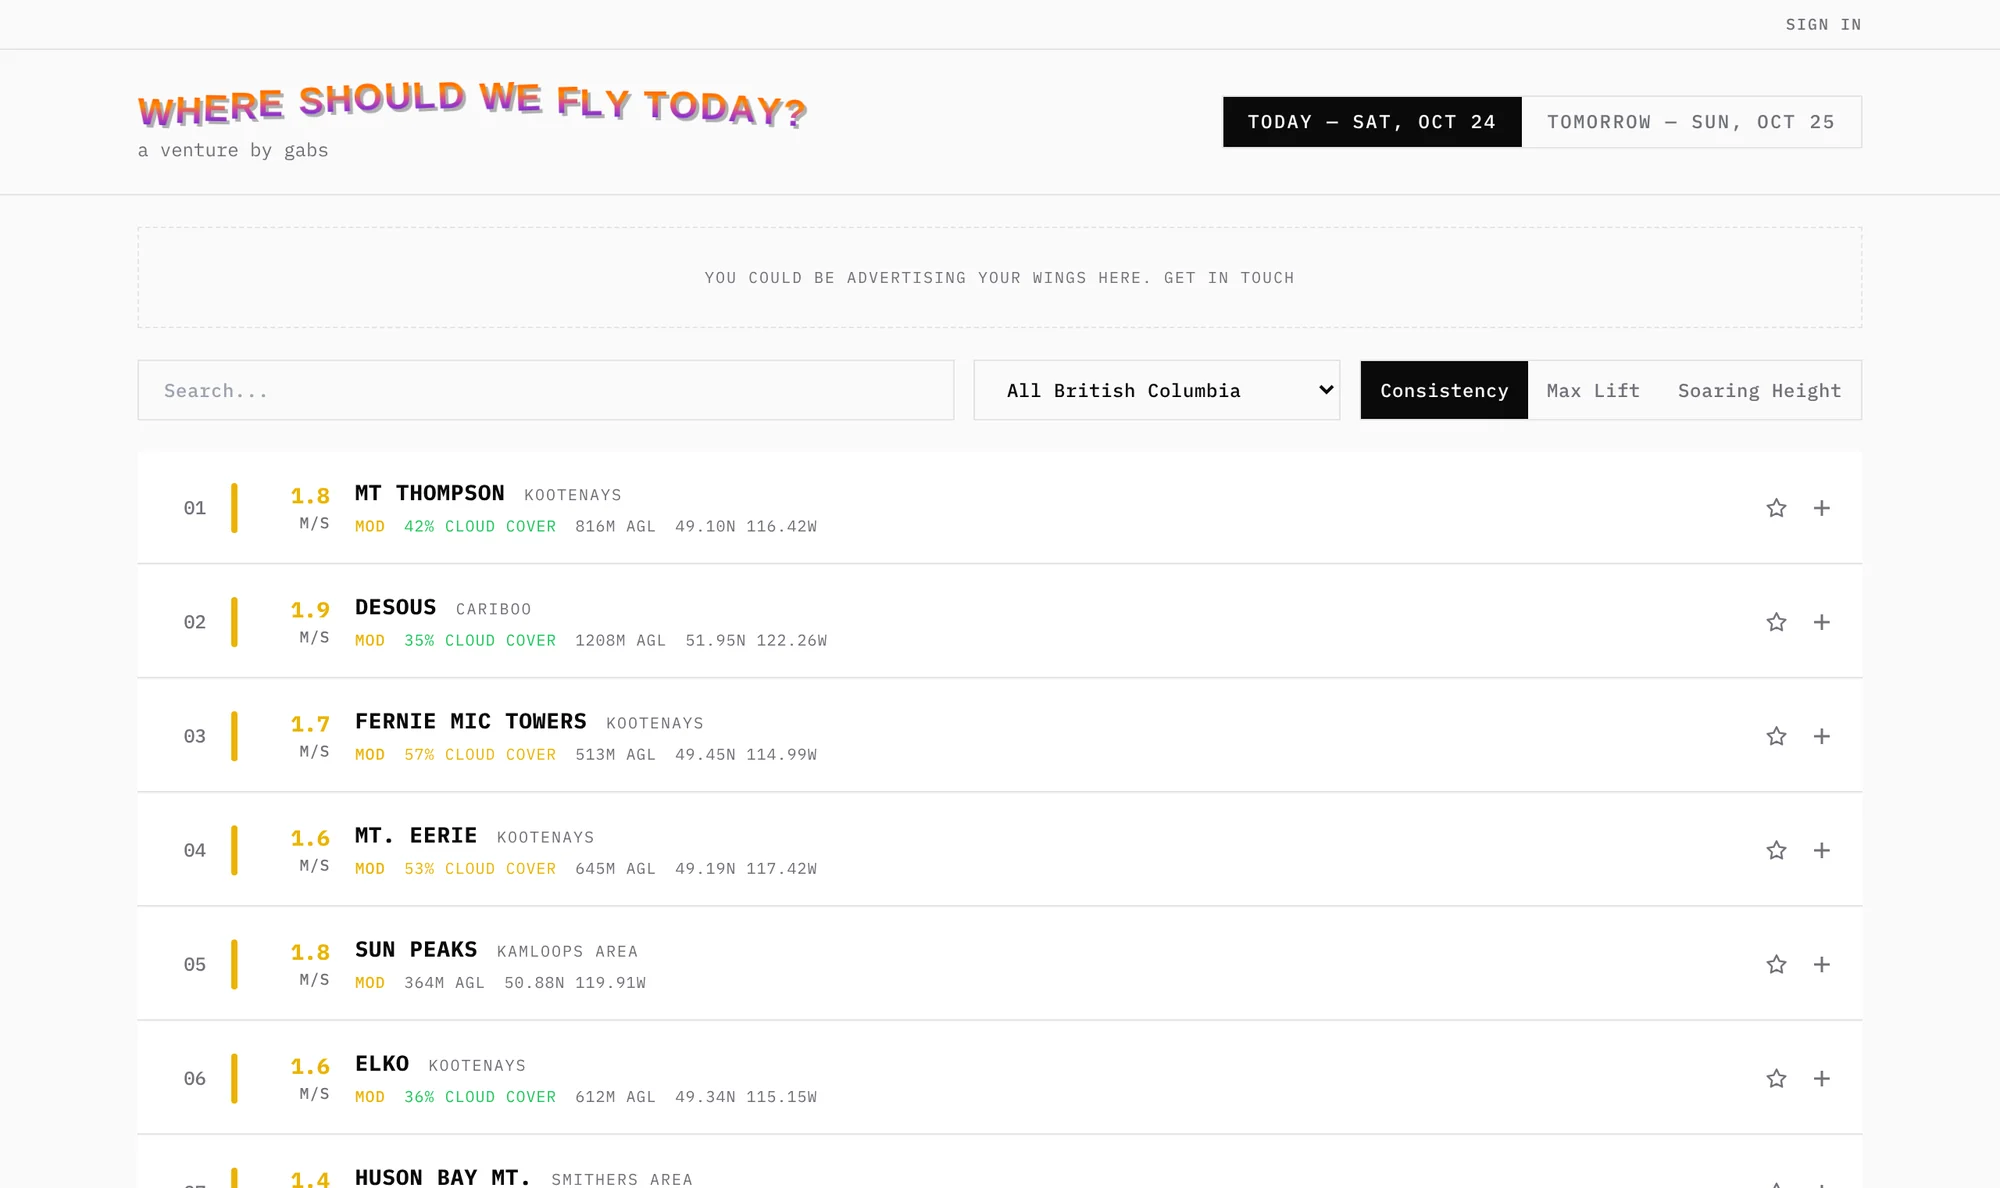
The morning forecast, already read
Deciding where to fly usually means a dozen open tabs: windgrams, station reports and model forecasts, one site at a time. Liftseeker does that reading for you.
It covers 223 launch sites, from the Kootenays and the Sea to Sky to the Prairies and Quebec, and ranks them for today and tomorrow. Open any site to see its forecast, the wind at altitude and the windgram the ranking came from.
Less research, more flying
-
One list instead of a dozen tabs
Every site’s forecast is read and scored, so the decision starts with a ranking rather than a research project.
-
Ranked the way pilots think
Sort by consistency (how strong the lift is, and for how long), by peak lift, or by how high you can expect to climb.
-
Its own five-day forecast
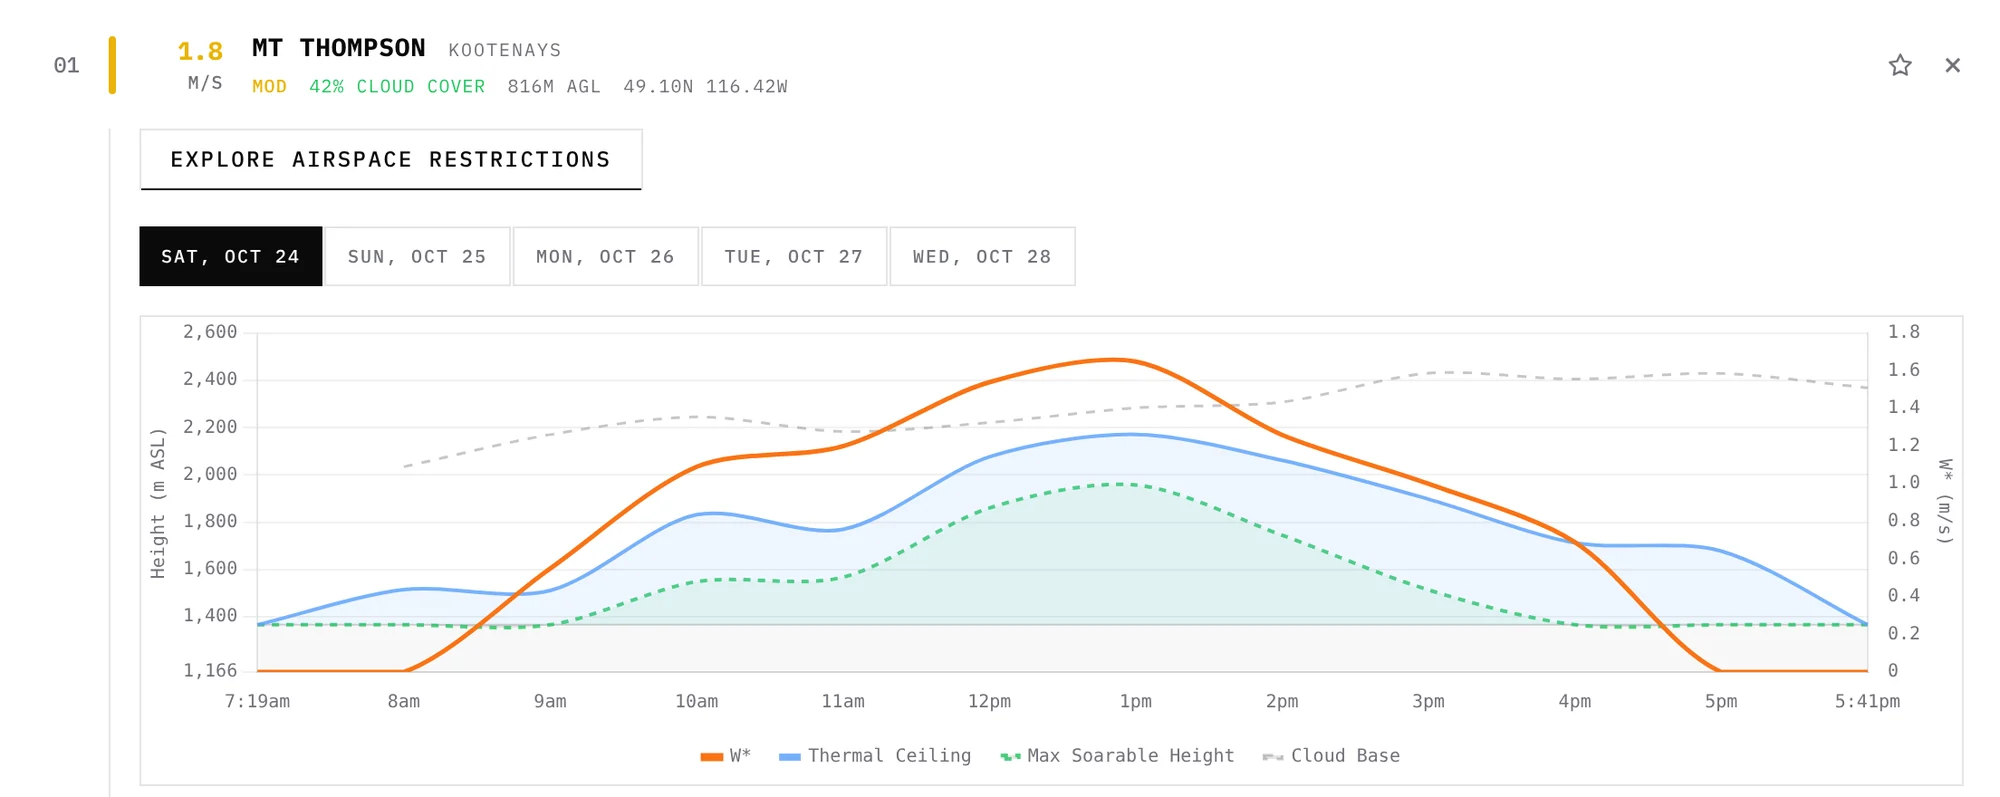
A built-in soaring model works out thermal strength, thermal ceiling, maximum soarable height and cloud base, hour by hour, from Environment Canada’s high-resolution model.
-
Tells you when it’s on
Star your sites and get a daily email when any of them meets the conditions you set. One more click opens Airplan to check the airspace above launch.
From a picture to a ranking
-
01
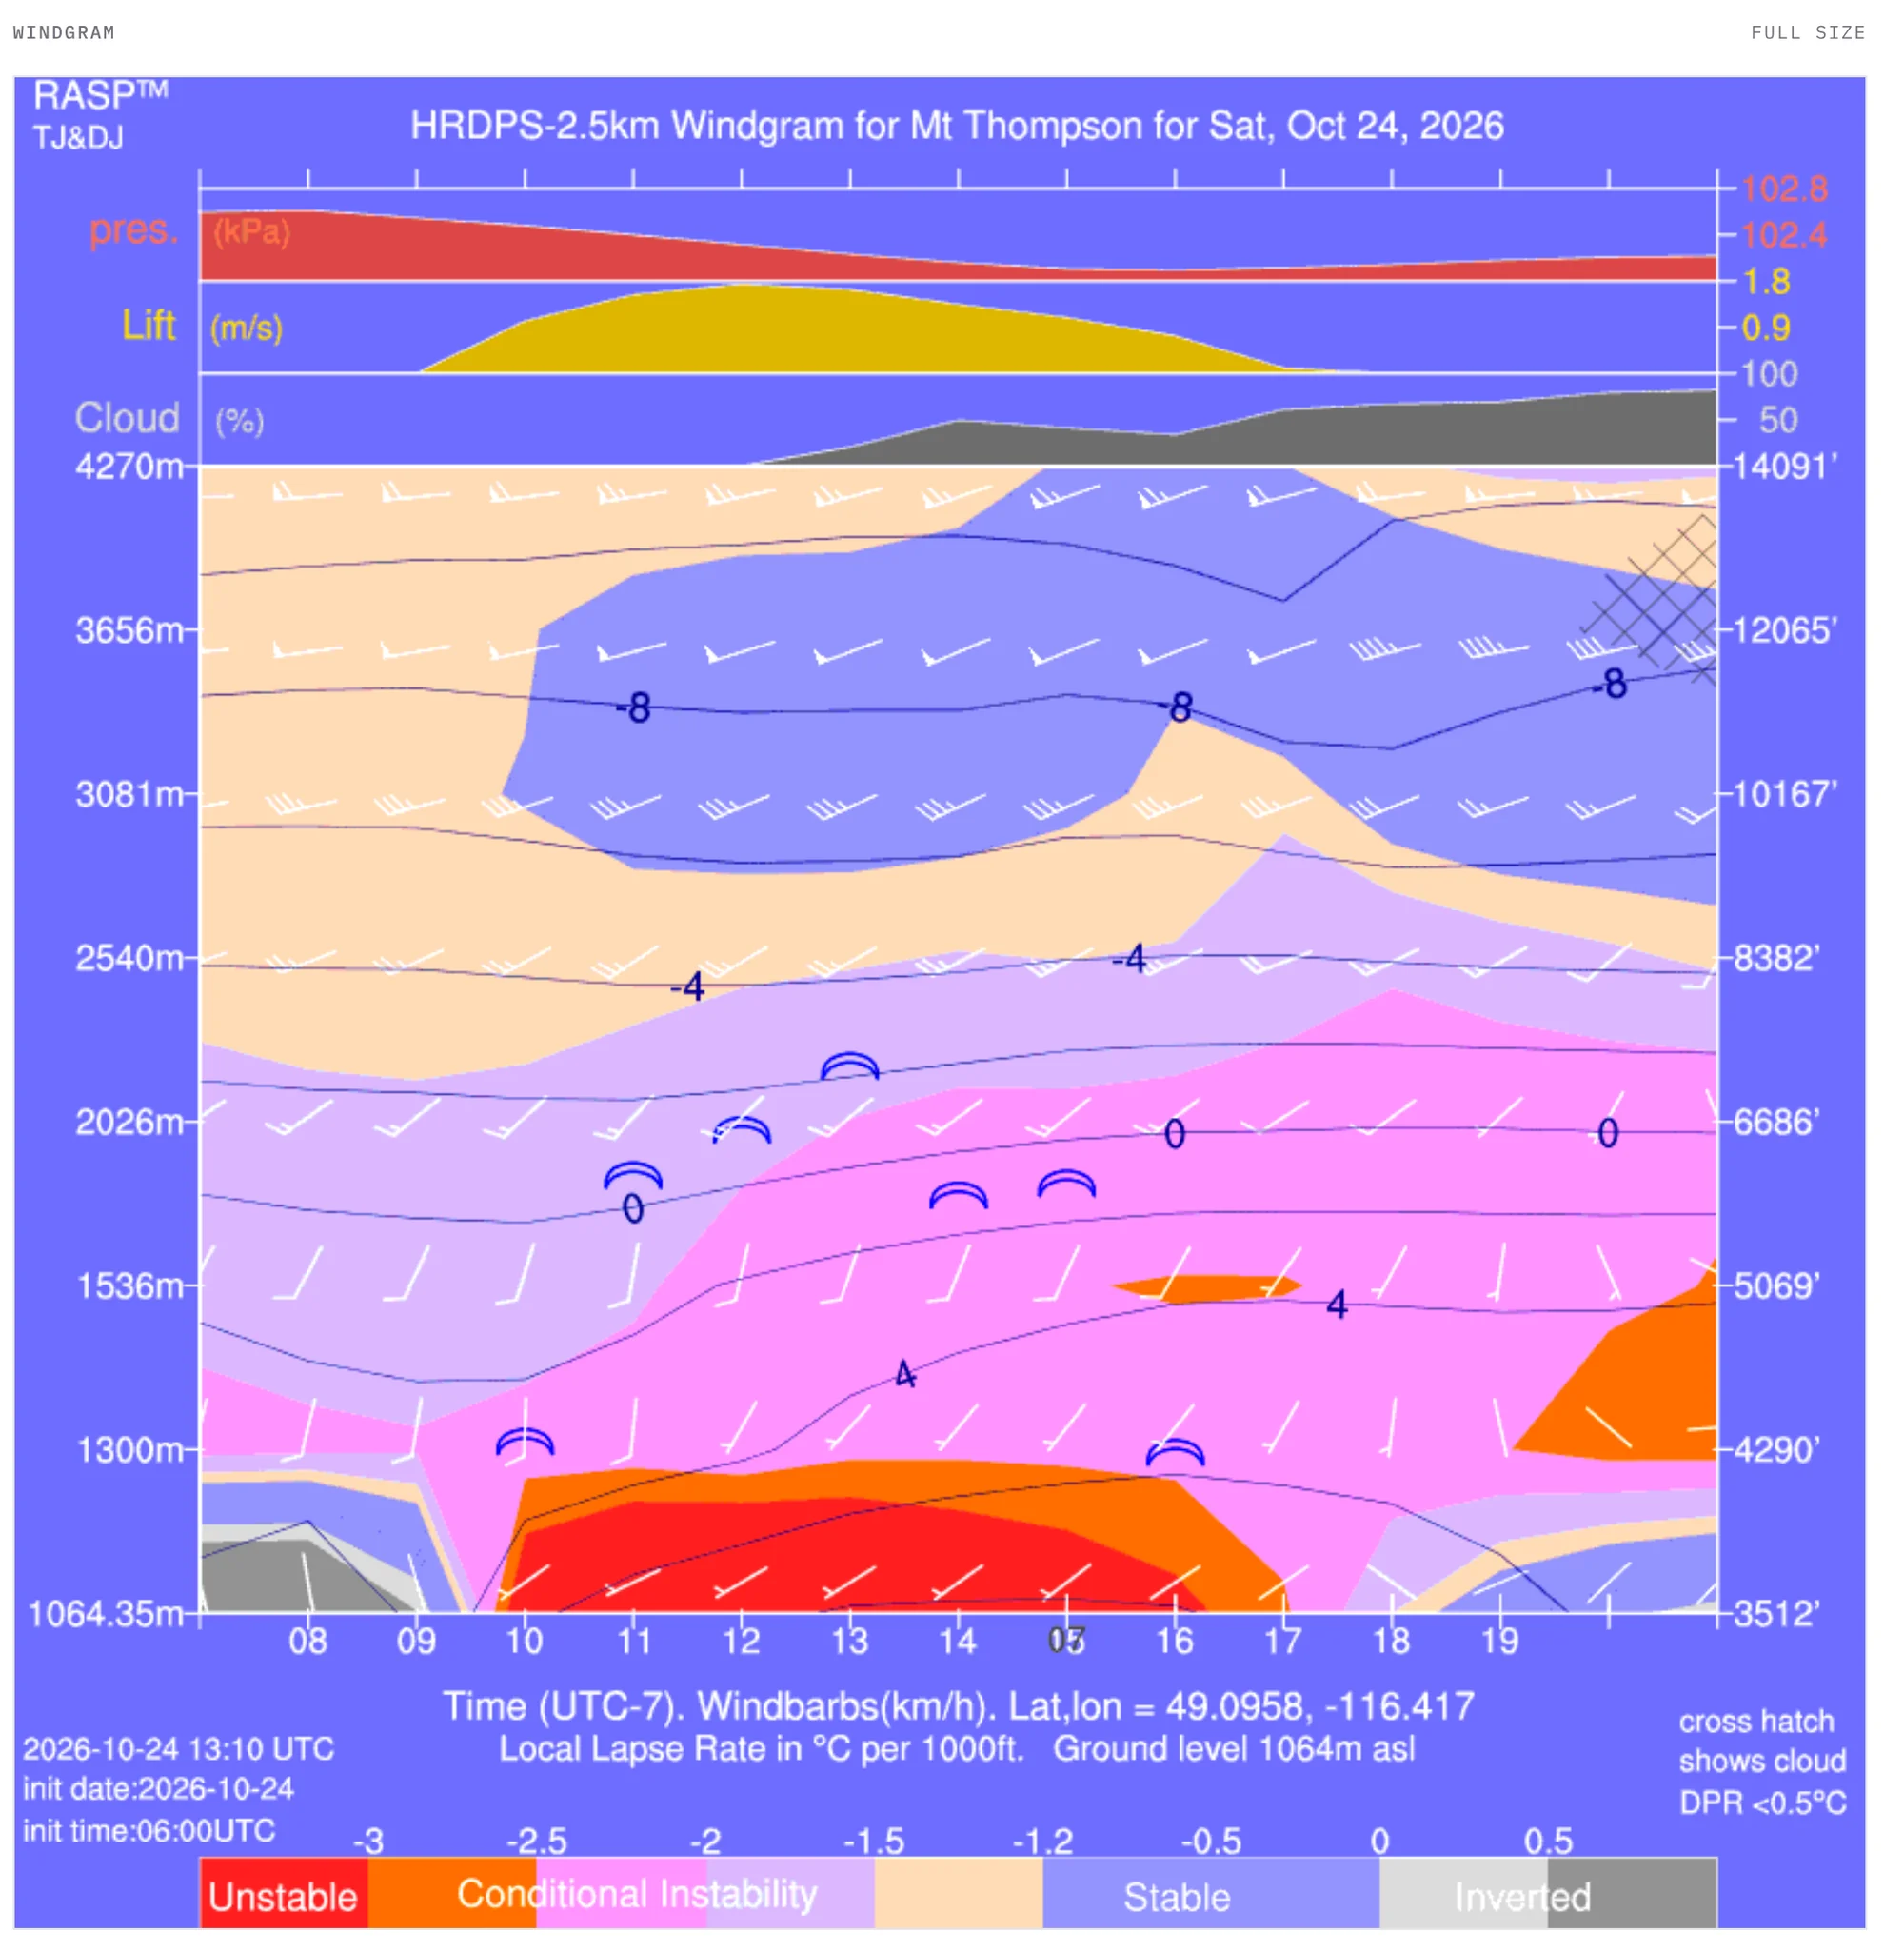
Read the windgrams
Each morning Liftseeker fetches every site’s windgram from CanadaRASP and reads the image itself: it finds the scale, measures the lift band and the top of the boundary layer, and turns a picture into numbers it can rank.
-
02
Model the day
For a longer view, a soaring engine works through the atmosphere above each site from the model data and charts thermal strength against the ceiling and cloud base for the next five days.
-
03
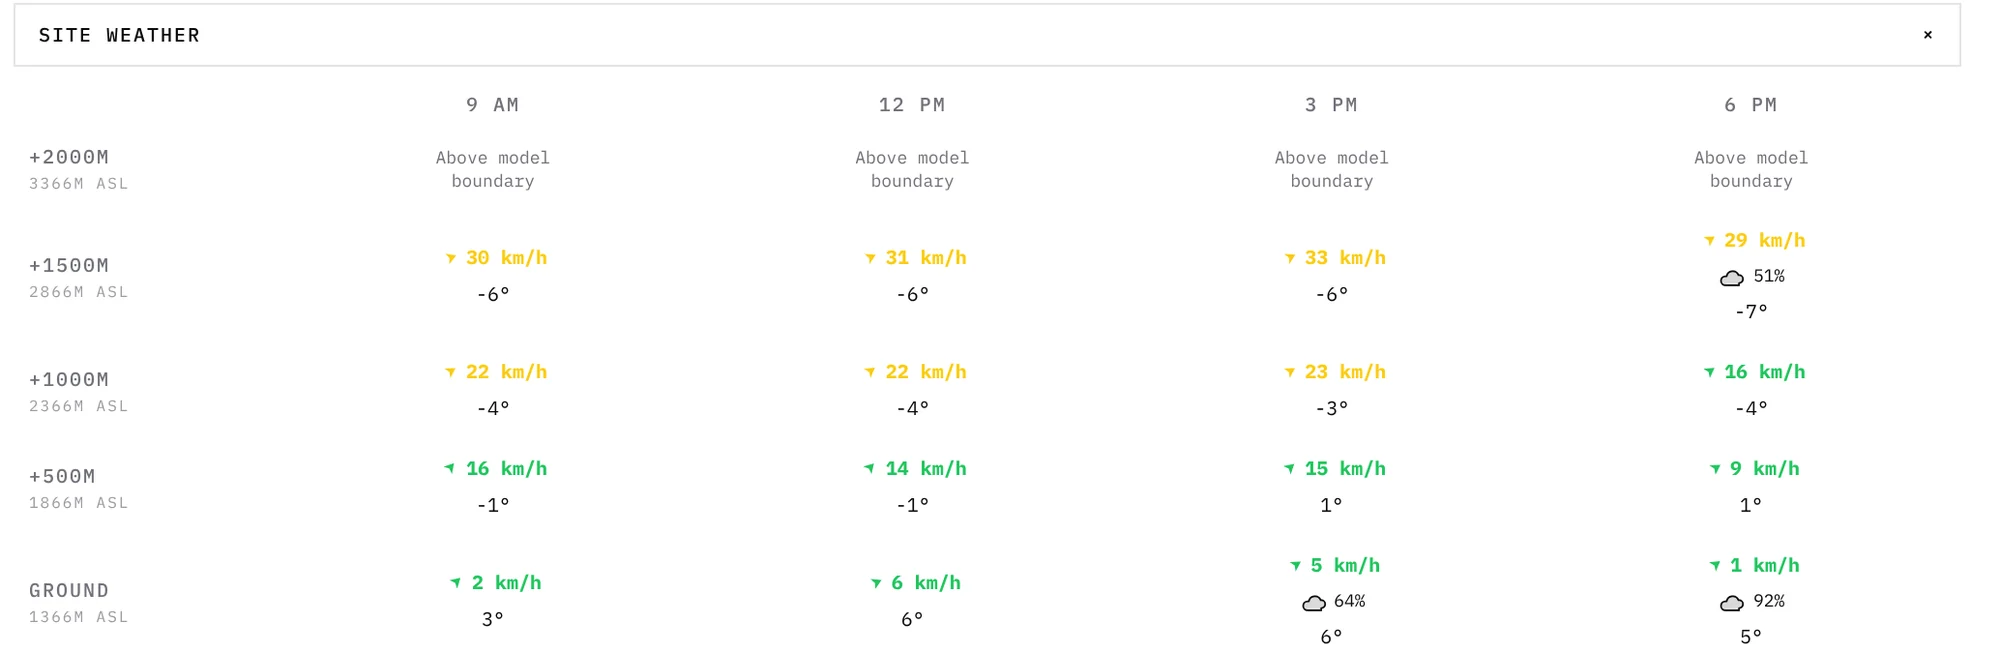
Check the wind aloft
Wind, temperature and cloud at launch and every 500 m above it, for the hours that matter, so a strong day that’s also a windy one doesn’t catch you out.
How it’s built
- Front end
- Next.js, TypeScript and Tailwind, with Chart.js for the forecasts
- Forecasts
- Environment Canada’s HRDPS model, decoded from GRIB2, with Open-Meteo as a fallback; windgrams from CanadaRASP
- Accounts
- Google, Facebook or email sign-in, Postgres through Prisma, email alerts through Resend
- Hosting
- Vercel